
Rate Markets Update · Tuesday, January 6, 2026
2025 Year in Review | 2026 Rate Markets Preview
PART I: RATE MARKETS UPDATE - 2025 Year-In-Review
For markets, 2025 was a year focused primarily on two things: Policy changes under President Donald Trump and adjustments to monetary policy led by the FOMC
The US Treasury yield curve slowly steepened throughout 2025 due to Fed rate cuts and sticky inflation
Economic data, with the exception of the jobs data, was consistently better-than-expected throughout the year, leading to fewer rate cuts than the market had anticipated at the beginning of 2025
The FOMC cut rates 75 bps during 2025; Current market pricing implies two, 25 bp rate cut for 2026 – but not starting until June
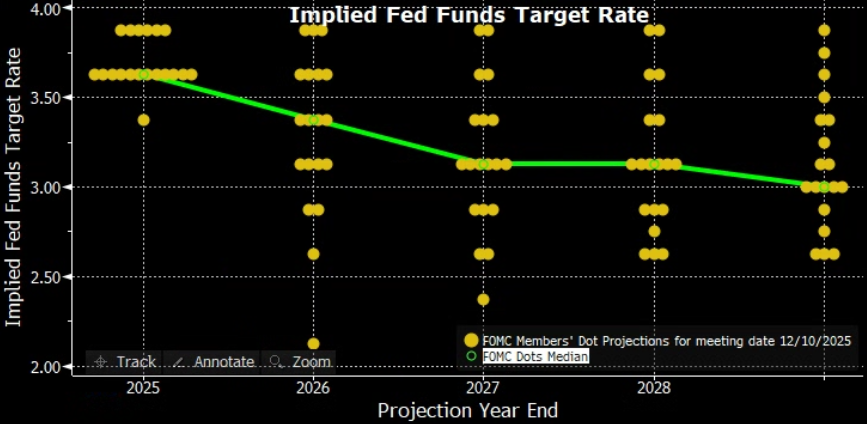
The current consensus Fed “dot-plot” implies only one, 25 bp rate cut for 2026
For 2026, rates will be primarily impacted by economic and inflation data, personnel changes within the FOMC and the impact on monetary policy, and the continued uncertainty created by President Trump’s economic, defense and trade policies
Geopolitics may also create rate “surprises” during 2026 – China, Russia, South America and the Middle East remain geopolitical “hot-spots”
Given recent developments in Venezuela, geopolitical tensions are elevated as we enter 2026 – this may be a key theme for 2026
The Fed will likely focus on the labor market during the first half of 2026 – perceived weakness in the labor market was the primary reason for Fed rate cuts in 2025
Core inflation remained mostly static during 2025; However, lingering inflation concerns could potentially be a major factor for the rate markets in 2026
2025 was a very interesting year – the US economy continued to defy forecasts calling for a slowdown, but the labor market showed signs that significant weakness could be on the horizon. Inflation held steady throughout most of the year, though there was some upward pressure on inflation as we moved through Q4 2025. The FOMC lowered the benchmark overnight rate 75 bps in 2025, via a series of 25 basis point rate cuts. From my perspective, the 2025 rate cuts were done to prevent a major deterioration in the US labor market. The other major event for rates this year was the start of President Donald Trump’s second term as US President.
President Trump got right to work, and his firebrand rhetoric, liberal use of executive orders and talk of tough tariffs spooked the rate markets initially – rates increased and the curve steepened. However, looking back, the president’s new domestic and global policies had little “real” lasting impact on rates or on the performance of the US economy. Once market participants got used to the “new” trading environment, rates stabilized and settled-down. However, the yield curve continued to slowly steepen all year, as questions about the direction of stubborn inflation permeated the market. Without question, there was a lot of “noise” and uncertainty during 2025 – ultimately, the market traded through it and seems mostly comfortable with the “new normal” as we enter 2026.
TABLE 1: SOFR Swap Rates | 2025 Recap– Net Change in SOFR Swap Rates YoY
The table below details the movement in SOFR swap rates and 1-Month Term SOFR during 2025. Swap rates initially moved higher due to new policies from the Trump Administration, particularly high tariffs and an aggressive US trade policy. Rates moved lower in the second half of the year as the market got more comfortable with President Trump’s often abrupt policy changes. Furthermore, the anticipated tariff-driven inflation did not materialize. A series of Fed rate cuts and a softer labor market also contributed to lower rates in the second half of 2025. However, the yield curve continued to steepen throughout 2025 as tariff-driven inflation fears lingered. You can see from the below table that short term rates were down significantly more than long-term rates in 2025.
Swap Tenor | December 31, 2024 Rate | December 31, 2025 Rate | YoY Difference: |
1 Year | 4.176% | 3.427% | -74.9 bps |
2 Year | 4.078% | 3.311% | -76.7 bps |
3 Year | 4.055% | 3.338% | -71.7 bps |
5 Year | 4.038% | 3.463% | -57.5 bps |
10 Year | 4.071% | 3.802% | -26.9 bps |
1M CME Term SOFR | 4.3325% | 3.6875% | -64.5 bps |
Source: Bloomberg, LLP – SOFR Swap Rate Movement 12/31/2024 vs. 12/31/2025
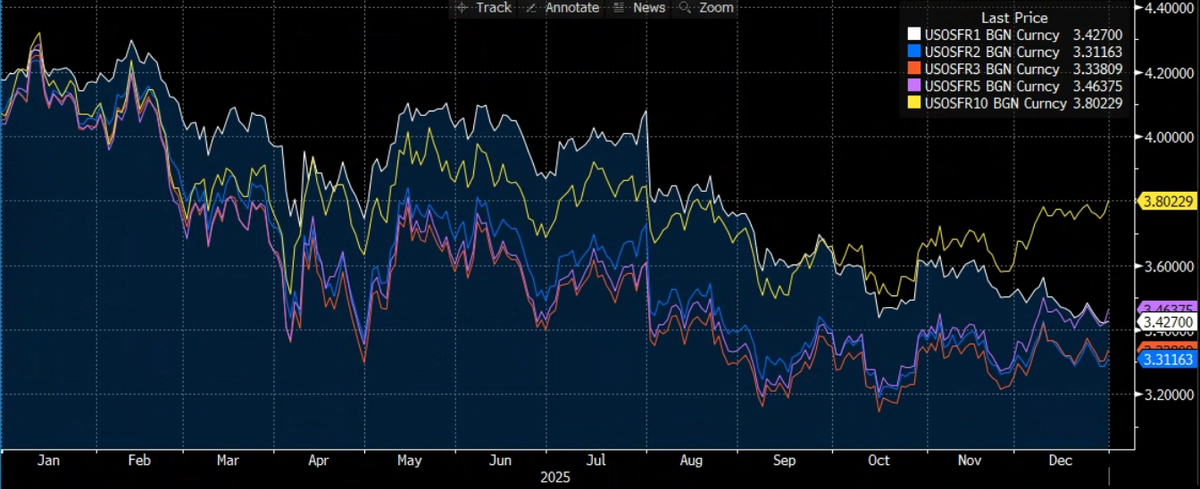
CHART 1: SOFR Swap Rates | 2025 Recap Graph – 1Y, 2Y, 3Y, 5Y & 10Y SOFR Swaps
The Bloomberg graph below shows 1Y (white), 2Y (blue), 3Y (orange), 5Y (purple) and 10Y (gold) SOFR swap rate movements for 2025. Periods of elevated rate volatility were spaced out throughout the year. Early in the year, the main market catalyst was President Trump and the wide range of policy initiatives he quickly enacted. Chief among them was a radical change in the US approach to trade negotiations. Talk of tariffs dominated the first and second quarters last year. In the middle of the year, rates ticked higher, the curve steepened, and rate cut bets were curtailed, as traders feared a sudden tariff-driven spike in inflation. As we know, that did not happen.
Market sentiment changed in July when the Fed signaled that they had real concerns about labor market weakness, and were prepared to adjust monetary policy accordingly. As we moved into Q4, swap rates decreased again as the Fed cut rates and inflation remain subdued, but then became mired in a trading range due to a government-shutdown led lack of economic data. We remain in that trading range as we head into 2026. To illustrate the volatility we witnessed this year, the trading range for the 2Y swap rate was 3.186% (low on 10/16/2025) – 4.236% (high on 1/13/2025) – that is a wide trading range and underscores the uncertainty surrounding rate cuts, the economy, the labor market, inflation and President Trump’s new policies that we experienced in 2025.
1Y 2Y, 3Y, 5Y & 10Y SOFR Swap Rate Movement During 2025
Source: Bloomberg, LLP 1Y, 2Y, 3Y, 5Y & 10Y SOFR SWAP RATES – CHANGE ON YEAR, 2025
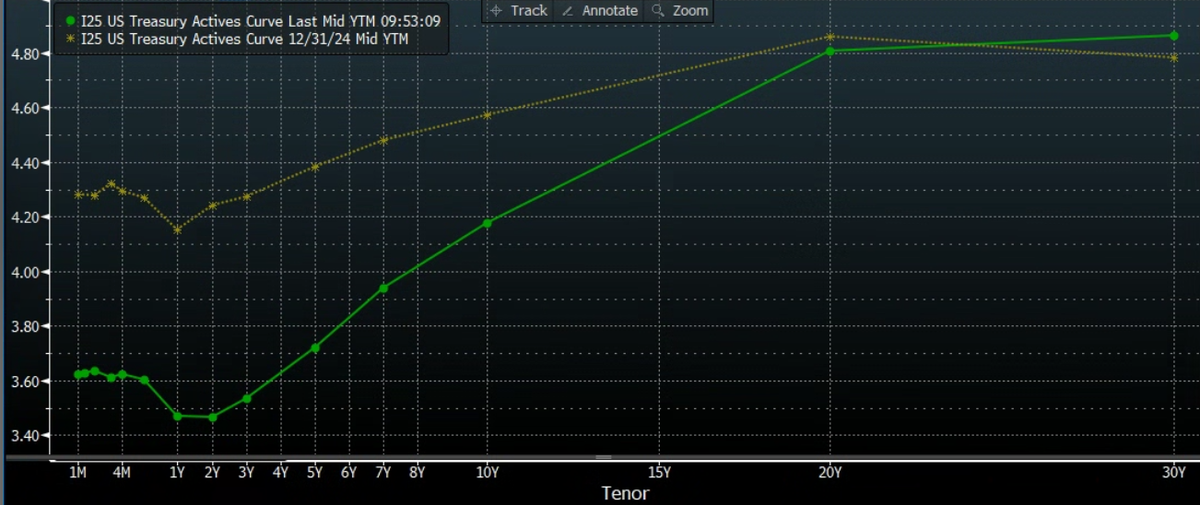
CHART 2: US Treasury Yield Curve | 2025 Recap – Fed Cuts Rates, Yield Curve Steepens
The following Bloomberg graph depicts the U.S. Treasury yield curve on 12/31/2025 (green line) vs. the UST yield curve from one year ago (gold line). The graph powerfully illustrates the massive change in the shape of the yield curve witnessed in 2025. Throughout the year, short-end rates continued to drop due to strong economic performance, relatively stable inflation and Fed rate cuts. Fears that President Trump’s economic and trade policies would reignite inflation and/or stifle economic growth did not materialize to any significant degree. That helped keep short term rates moving lower. However, lingering fears that inflation would eventually be pushed higher due to tariffs anchored long term rates, and the yield curve steepened significantly.
US Treasury Yield Curve Change: DEC 31, 2024 (Gold) – DEC 31, 2025 (Green)
Source: Bloomberg, LLP | US Treasury Yield Curve 12/31/2024 vs. 12/31/2025
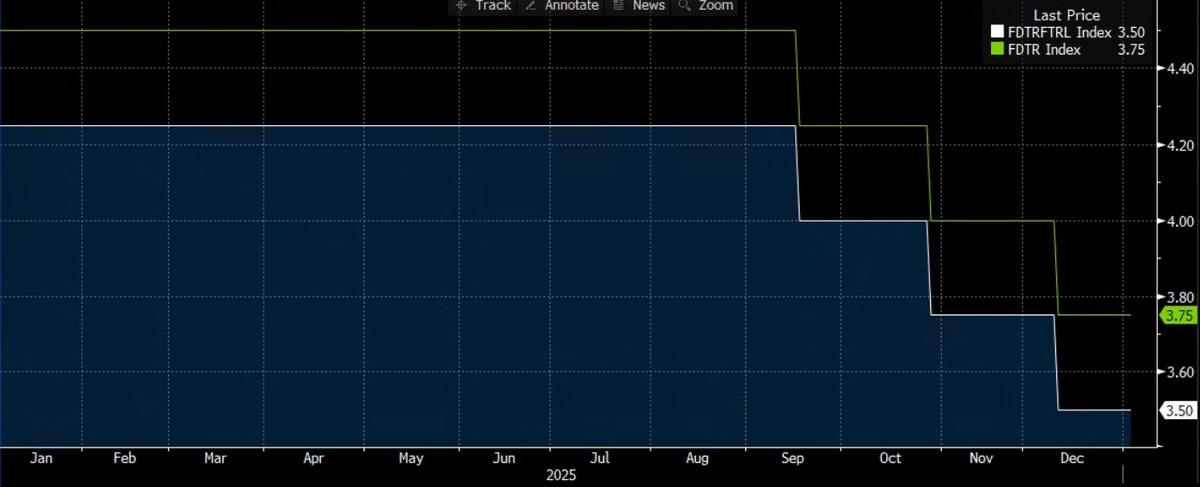
CHART 3: FOMC | 2025 Recap – FOMC Cuts Benchmark Rate 75 bps During 2025
The Bloomberg graph below details the timing and magnitude of FOMC rate cuts during 2025. The Fed started the year on hold, and remained on the sidelines until the September meeting. Starting in September, the Fed commenced with a series of 25 basis point interest rate cuts. The FOMC also cut rates 25 bps at the October and December meetings. The current overnight rate is 3.50% lower bound / 3.75% upper bound.
The other significant development for the FOMC in 2025 was the dramatic increase in political pressure from the President. President Trump was highly critical of the Fed and Chairman Powell throughout 2025. President Trump threatened to fire the Chairman on numerous occasions, and aggressively tried to manipulate and reshape the Fed toward his objective – dramatically lower rates. In the end, the President was not able to dramatically alter the face of the Fed in 2025, or their monetary policy decisions.
FOMC Rate Decisions 2025: Upper and Lower Bound
Source: Bloomberg, LLP – FOMC Monetary Policy Moves During 2025
PART II: RATE MARKETS UPDATE - 2026 Preview
2026 will once again hold unique challenges for the Fed and for market participants. At the start of 2026, the key market theme shaping up is once again, uncertainty. FOMC uncertainty. Rate uncertainty. Geopolitical uncertainty. Inflation uncertainty. US political uncertainty. I’ll stop there! Currently, the market is fearful of committing to any given rate path considering the amount of potential wildcards it could face in 2026. The other factor that has prevented traders from moving rates materially is the lack of fresh economic data created by the longest government shutdown in US history. We are finally set to get back on track with fresh economic data coming this week.
The primary factors that could have the most impact on the rate markets during 2026 are:
Economic, trade and political policy changes enacted by the Trump Administration. President Trump is clearly a President who favors quick, aggressive and decisive actions. That approach will likely continue to keep the market off-balance in 2026.
Lingering fears high tariffs will lead to a spike in consumer inflation and a dramatically steeper yield curve.
The direction of monetary policy. We have a divided FOMC with new incoming voting members, and we will see a new FOMC Chairman in June. That is a lot of change and uncertainty for traders to digest and manage.
The resumption of up-to-date economic data. Market participants have been flying blind for some time, so both the market and Fed are eager to see a fresh run of economic and inflation data.
Concerns the “AI frenzy” is creating a market bubble that could be due for a significant correction. If it happens, it could create a massive flight-to-quality and dramatically lower term rates.
Geopolitical tensions. Geopolitical tensions are not likely to abate significantly in 2026. Recent events (Venezuela, Iran, Cuba, Greenland) foreshadow that geopolitical concerns, led by US decisions, are likely to move front-and-center for the market in 2026. Whether or not you subscribe to President Trump’s “new world order” or not, it is clear that the President has no plans to abandon his objective of dramatically redefining the US’s role in the global political and economic arenas.
We start the year off with a bang – the December Employment Report is scheduled for release Friday, 1/9 at 8:30 am. Make no mistake, the FOMC will be data driven this year, so the jobs, inflation, GDP and consumer spending data will continue to be the deciding factors in determining the Fed’s next move. The Fed is also likely to once again face increased political pressure and interference this year. The FOMC will be challenged to avoid distractions and keep their eye on the prize. Geopolitical tensions escalated as we hit year-end, and that market wildcard is likely to continue throughout 2026.
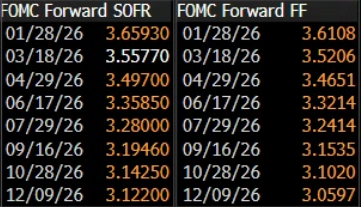
CHART 4: Traders Anticipate Significantly Slower Pace To FOMC Rate Cuts in 2026…But Uncertainty Remains!
Currently, forward market pricing implies ~56 bps of cumulative rate cuts for 2026. That equates to two, 25 bp rate cuts and the possibility of one more. The next rate cut is not forecasted to occur until June 2026. There is some speculation that Chair Powell may seek to end his term as FOMC Chairman with one final rate cut in April, but that is currently not reflected in forward market pricing to any significant degree.
Ultimately, I put little credence in current Fed rate cut forecasts and/or implied market pricing given the tremendous uncertainty we are facing as we begin 2026. There are just too many wildcards. I am most concerned about rising inflation, a softer jobs market and escalating geopolitical instability – instability that the US is largely contributing to at the moment. Layer in new Fed members, including a new Chairman, and we have the recipe for a potentially tumultuous 2026.
Market Implied Fed Funds and 1-Month Term SOFR Rates For 2026 6
Source: Bloomberg, LLP | Market Implied Fed-Funds & 1-Month Term SOFR Rates For 2026, By Fed Meeting
CHART 5: FOMC CONSENSUS “DOT-PLOT” SIGNALS ONE RATE CUT FOR 2026
The chart below details the most recent FOMC “dot-plot”. The next consensus dot-plot will be released at the March 18 FOMC meeting, the second meeting of the year. As we know, the dot-plot is updated quarterly and can change dramatically. Last year the first Fed dot-plot of the year signaled two rate cuts for 2025 – the FOMC actually cut rates 25 basis points three times last year. More than anything, I think the current dot-plot illustrates the dissension that currently exists within the FOMC. You can see below that the distribution of “dots” shows there is still a high level of uncertainty within the FOMC surrounding the direction of monetary policy. There are some Fed officials that want to “hold” here, some that favor one more rate cut and then hold, and yet another camp that favors a series of aggressive rate cuts. It should be an interesting year for the Fed!
That said, I would not put too much credence in the current dot-plot, given the myriad market forces at work that traders and the Fed will have to contend with in 2026. There is still a high level of uncertainty in the market, and we are going to start seeing current economic data that will help frame the path forward for rates this year. Currently, the consensus dot-plot shows only one rate cut for 2026. Market pricing currently implies ~56 bps of cumulative rate cuts (~two, 25 bp rate cuts) for 2026. The market will be paying particular attention to Fed-speak, especially in the first quarter of 2026.
Most Recent “Dot-Plot” Shows FOMC Expects One Rate Cut In 2026
Source: Bloomberg, LLP | FOMC Consensus “Dot-Plot” For Through 2028
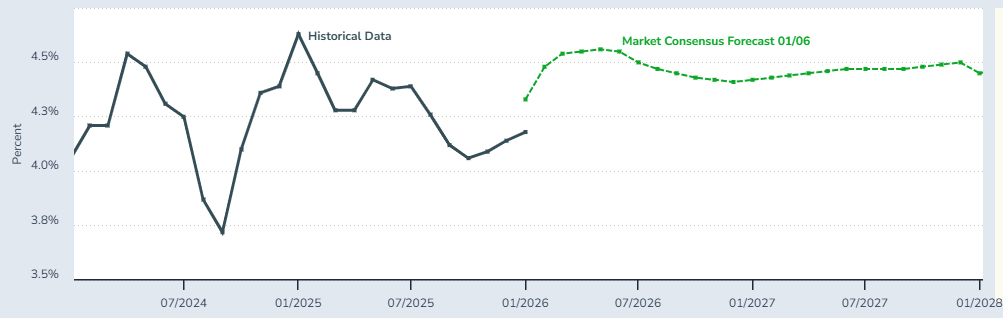
CHART 6: Forecasts Portend Higher Term Rates And A Steeper Yield Curve In 2026
Looking at the forecasts, there is real concern that term rates may be poised to continue to move higher in 2026, leading to a much steeper yield curve. The below Econforecasting graph shows the 10Y UST note yield forecast through the end of 2027. Current forecasts see 10-year US T-Note yields rising ~40 bps in the first quarter of 2026.
The yield curve is the steepest it has been in several years. I believe the curve will continue to steepen in 2026. The FOMC will have new voting members as of the January meeting, and a new Chairman in June. That makes the Fed a huge wildcard for 2026 – there is certainly the possibility that the Fed could continue to lower rates this year, perhaps aggressively if the President gets his way. Fears that Fed rate cuts and a delayed tariff effect will bump up inflation remain for 2026. That fear and uncertainty are likely to steepen the yield curve further in 2026.
Forecasts Call For Higher Term Rates In 2026 – US 10Y TREASURY NOTE YIELD FORECAST
Source: ECONFORECASTING | UST 10Y Yield Forecast Through 2027
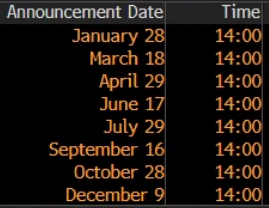
CHART 7: FOMC Meeting Schedule For 2026
The Bloomberg chart below details the FOMC meeting schedule for 2026. The next Fed rate decision is due on January 28, 2026 at 2:00 PM. The FOMC is expected to hold rates steady at the January 28th meeting. Current market pricing does not imply another 25 bp rate cut until June 2025. There is some growing speculation that Chairman Powell may seek to end his tenure with one last rate cut, so the odds for an April rate cut have ticked slightly higher in recent weeks. The Fed has stated they want to see the lagging effects of the prior rate cuts, and continue to monitor developments in the jobs market and with inflation. Powell hinted recently that we may be nearing the Fed’s “neutral rate”. The Fed may also be (will be) under increased political pressure this year, so we may see the contentious relationship between the FOMC and the White House continue in 2026. Fasten your seatbelts!
2026 FOMC Meeting Schedule
*All FOMC Rate Decisions released at 2:00 PM Eastern.
Source: Bloomberg, LLP | 2026 FOMC MEETING SCHEDULE
Disclaimer: The information provided in this communication is intended for discussion purposes only. Nothing presented in this communication should be taken as a recommendation or forecast. All market data shown is indicative only and subject to change depending on current market conditions. The information in this publication is confidential and is intended for the recipient only.