
Rate Markets Update · Tuesday, September 8, 2026
Rates Mostly Steady as Oil Approaches $100 per Barrel
- Markets Await Key Inflation Data Due Friday
Flash Update: US RATE MARKETS – TUESDAY SEPTEMBER 8, 2026
US Treasury yields and SOFR swap rates are holding mostly steady this morning as the market looks ahead to key inflation data due later this week
Rates were up in early trading, as Brent crude oil approached $100 per barrel; Rates have subsequently settled down and are close to unchanged from Friday’s closing levels
News out of the Middle East was light over the long weekend – however, oil prices are rising on supply fears as we approach the high demand winter months
The US-Iran conflict continues to be the primary focus for the rate markets
Markets are beginning to fear that the US-Iran conflict may continue indefinitely, leading to sustained higher inflation and reduced economic growth
A drawn-out conflict is likely to keep upward pressure on oil prices and interest rates for the near term
This morning, Canada imposed tariffs of 15% to 50% on hundreds of products from the US, risking a wider trade war with the US
The next FOMC rate decision is due on Wednesday, September 16th at 2:00 PM
Odds for a 25 bp September Fed rate jumped to ~60.6% after the strong August Employment Report results we saw on Friday
Next up for key economic data: August PPI prints on Thursday 9/10; August CPI prints on Friday 9/11 – both are released at 8:30 AM
Short-term SOFR swap rates are trading down ~1-2 bps this morning, depending on tenor
Medium-term SOFR swap rates are down ~1-2 bps currently, depending on tenor
Long-end SOFR swap rates are trading down ~2-3 bps this morning, depending on tenor
Good morning – US Treasuryyields and SOFR swap rates are holding mostly steady this morning, despite a jump in oil prices. Overall, the market is shaking off the increase in oil prices this morning. Initially rates were a touch higher, but they have since settled down and are trading close to unchanged from Friday’s closing levels.
The price of Brent crude oil approached $100 a barrel this morning, reinforcing expectations that global central banks will have to raise interest rates to contain inflation. The rise in oil occurred after Saudi Arabia said operations at facilities in the kingdom’s south were halted by attacks. The news out of Saudi Arabia is adding to growing supply fears as we approach the high demand winter months in the US. Upward pressure on oil prices is likely to continue to put upward pressure on term rates. The short end of the curve will also be in focus as we head towards the September FOMC meeting next week.
Fear of sustained upheaval in the Middle East will likely drive markets in the early part of the week – economic data is relatively light until Thursday’s August PPI print. I expect this week to gradually build toward Friday’s CPI print, data that may be decisive in whether the FOMC hikes rates or holds them steady this month. September rate hikes by the European Central Bank (ECB) and Bank of Japan (BOJ) are largely priced in.
From my perspective, the August jobs data we saw Friday “green lights” a 25 bp rate hike at the next Fed meeting, but it does not guarantee one! Whether the Fed will proceed with a rate hike or not may hinge on Friday’s release of the August CPI data. Should inflation remain static, or come in lower than expected, I do feel like the FOMC has the breathing room to tighten, should they feel the current level of inflation merits more restrictive policy. A higher-than-expected CPI result will likely lead to an increase in rate hike odds for next week. Currently, odds for a 25 bp rate hike next week are sitting at ~60.6%.
Bottom line for rate markets: Market uncertainty remains at elevated levels. Traders continue to try to manage myriad market forces currently. Geopolitical risks remain at the fore for markets, but tariffs, possible Treasury Department intervention, a hawkish, tight-lipped Fed, the release of key economic data and a changing economic paradigm due to the growth of AI are but a sample of the various market forces at work.
CHARTS OF THE DAY:
A: GROWING US DEFICIT A CONCERN FOR BOND MARKETS
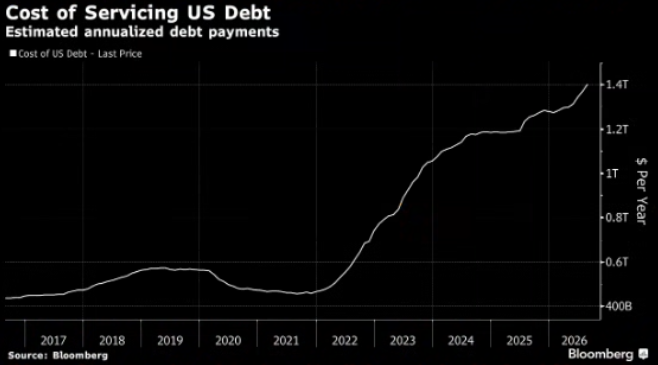
Source: Bloomberg, LLP | ANNUALIZED COST OF SERVICING US DEBT SINCE 2016
B: SHORT-END SWAP RATES STAY ELEVATED SINCE WARSH TESTIMONY
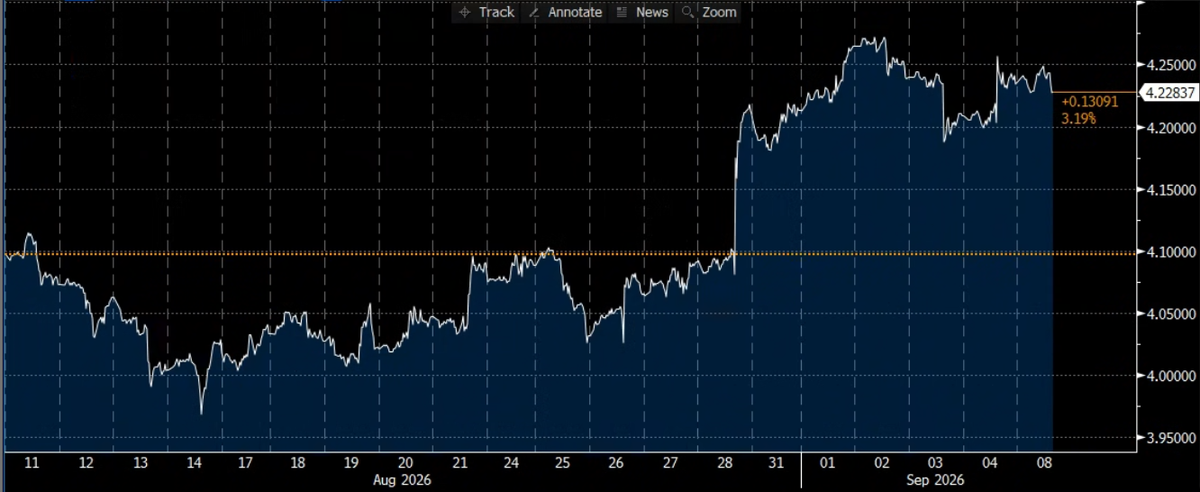
Source: Bloomberg, LLP | 2-YEAR ANNUAL OIS SWAP RATE, PRIOR 30-DAYS
“Key News” the market is tracking includes:
Geopolitical developments continue to weigh on markets.Developments in the US/Iran “war” will continue to captivate the market’s attention. l
Lack of forward guidance from the Fed is forcing traders to pay more attention to economic data – this may fundamentally change the way markets position for and react to Fed rate decisions going forward.
Market participants continue to track developments in the US equities markets. There is still a sharp focus on the performance of the growing AI sector. Overall market sentiment, and perhaps even economic performance, may be impacted by tech-sector results for the foreseeable future.
Tariffs remain in focus, particularly the developing situation between the US and Canada. US/China relations are always in focus. On many levels, more tariffs are last thing global markets need right now – they are already grappling with massive inflation uncertainty due to the conflict in the Gulf.
The US Treasury Department’s recent bond market intervention sets the stage for more to come. Stay tuned!
FOMC Update:
Key data that will be squarely on the Fed’s radar prior to the September meeting includes PPI (9/10), CPI (9/11) and Retail Sales (9/16). The FOMC will see plenty of key data prior to the rate decision due on 9/16. The upcoming inflation data will likely be an “all-hands-on-deck” moment for rate markets. Traders are back from “summer vacation” and ready to go!
Market implied odds for a 25 bp September Fed rate hike are currently sitting at ~60.6%.
SOFR Swap Market - Quick Summary:
The 1Y SOFR swap rate is trading down ~1-2 bps this morning. 2Y and 3Y SOFR swap rates are currently trading down ~1-2 bps. 5Y and 10Y SOFR swap rates are trading down ~1-2 bps this morning. The very back-end of the swap curve (20Y and 30Y) is currently down ~2-3 bps from Friday’s closing levels.
CHART 1:US RATES SNAPSHOT: 9:15 AM Eastern
Chart 1 Key:
Far Left Columns:US Treasury Yields & Change on Day (bps)
Center Columns:SOFR OIS Swap Spreads (bps) & Change on Day (bps)
Far Right Columns:SOFR OIS Swap Rates & Change on Day (bps)
Please note: Market levels can change rapidly – rate cap premiums are subject to a dynamic market that can change frequently.
UST YIELDS | SWAP SPREADS | SOFR SWAP RATES
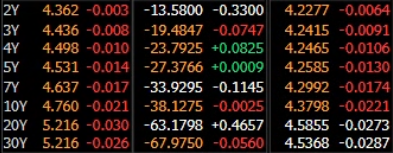
Source: Bloomberg, LLP | 9:15 AM NY Rates Snapshot
CHART 2, 2A & 2B: SOFR SWAP RATES MOSTLY STEADY DESPITE JUMP IN OIL PRICES
SOFR swap rates are holding mostly steady this morning despite a jump in crude oil prices. Traders have learned to absorb fluctuations in oil prices, which likely explains the market’s “wait-and-see” mode this morning. Market participants are also looking ahead to Friday’s critical CPI print.
The blowout jobs report we saw Friday likely puts the labor market on the “backburner” for the Fed and ensures that inflation remains in the spotlight. As such, this week’s PPI (9/10) and CPI (9/11) inflation data may be the critical data that decides if the Fed hikes 25 bps or holds off for another meeting.
I expect the bias for rates to remain to the upside, at least until we see the inflation data later this week. The conflict in the Middle East remains a huge wildcard for markets – there is just too much uncertainty to predict a viable outcome. This much is clear to me – there is not likely to be any significant rate relief until oil prices drop significantly, and so long as the inflation threat looms, upward pressure will remain on swap rates. The trade war with Canada and surging US deficit will also continue to keep upward pressure on rates. At this juncture, I do not see a clear catalyst for materially lower rates on the immediate horizon.
US-IRAN WAR IMPACT: Key SOFR Swap Rate Movements Since The US-Iran War Began
The 2-year SOFR swap rate closed at 3.21% on Friday 2/27/2026 – it is currently trading at ~4.228%(+101.8 bps)
The 5-year SOFR swap rate closed at 3.22% on Friday 2/27/2026 – it is currently trading at ~4.258%(+103.8 bps)
The 10-year SOFR swap rate closed at 3.52% on Friday 2/27/2026 – it is currently trading at ~4.380%(+86.0 bps)
SOFR swap rates across the curve are sitting at 12-month highs
CHART 2:Short-End SOFR Swap Rates – Year-To-Date 2026
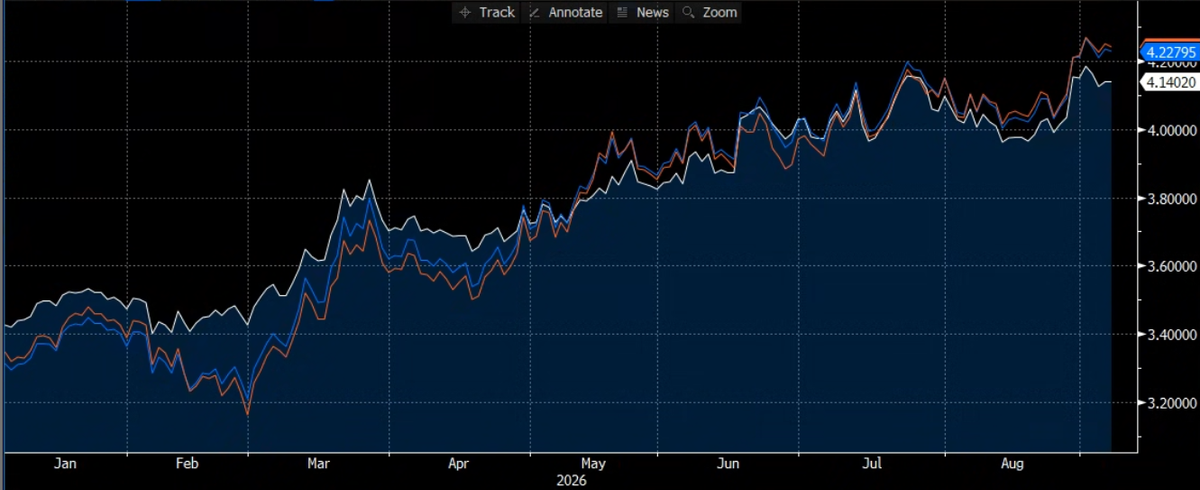
Source: Bloomberg, LLP | 1Y (white), 2Y (blue) & 3Y (orange) SOFR SWAP RATES; YTD
CHART 2A:Long-End SOFR Swap Rates – Year-To-Date 2026
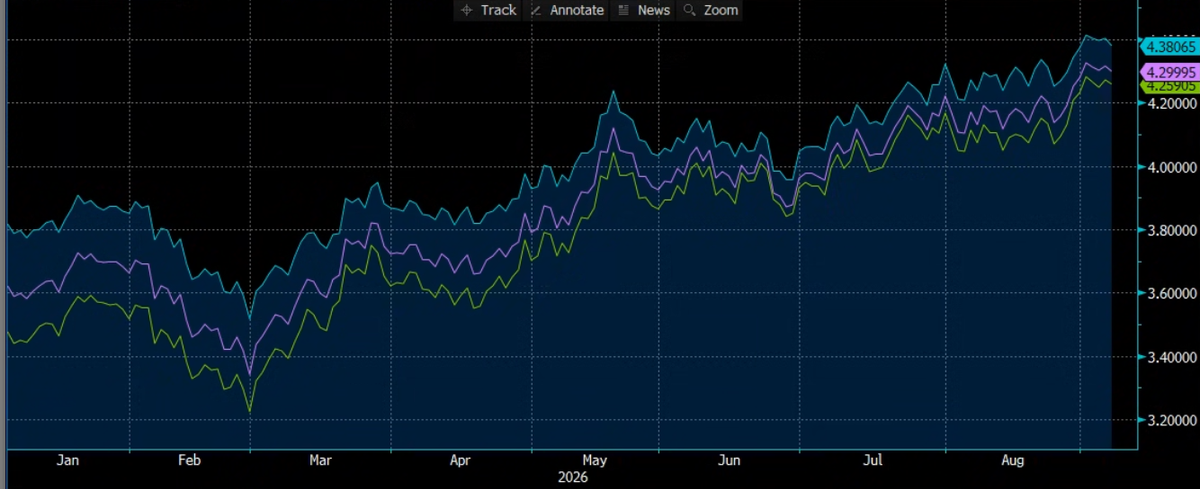
Source: Bloomberg, LLP | 5Y (green), 7Y (purple) & 10Y (light blue) SOFR SWAP RATES; YTD
CHART 2B: US Treasuries: Yield Overview – Year-To-Date 2026
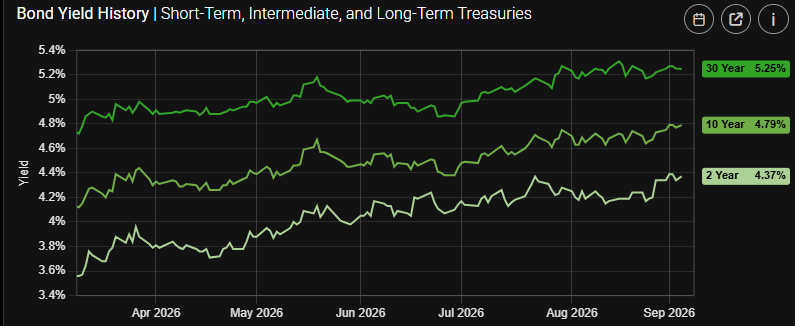
Source: StreetStats | US Treasury Yields; YTD 2026 (30Y UST yield – top line; 10Y UST yield – middle line; 2Y UST yield – bottom line)
RCA Product & Pricing Update:
Product Spotlight: What We Are Seeing In The Rates & Derivatives Markets
The market is once again facing tremendous uncertainty surrounding the path forward for interest rates. Borrowers should be as nimble as possible in this market environment. Cap purchasers should onboard as quickly as possible – there is no cost to onboard. It is important to be in a position to take advantage of market opportunities quickly and efficiently.
There is an increasing interest in exploring interest rate swaps as a possible hedge alternative. IR Swaps lock in a synthetic fixed rate and do not require an upfront premium. Unlike an interest rate cap, however, swaps are secured derivatives, so the counterparty selection process is more challenging with a swap. It is often challenging to place a swap away from the lender or incumbent relationship bank. There are also additional variables that factor into the decision to pursue an interest rate swap, or to unwind an existing swap. With the uptick in swap rates recently, we are also seeing an increase in swap termination requests. Please let us know if you would like to learn more about interest rate swaps, or swap terminations. RCA offers a full range of Derivative Advisory services.
Given the high-level of uncertainty surrounding forward rates, many clients are grappling with when or if to extend. This is a difficult question – our advice has been to monitor the market closely and be on-boarded and ready to trade, should the market move in your favor. We also advise borrowers to check the market pricing for extensions. Market price discovery is a key component to any cap transaction – new caps, extensions, or terminations.
We are still seeing some residual demand for interest rate floor indications – to offset high loan floors or simply to benefit from declining variable rates. Borrowers who have “floors” embedded in their loans have been considering purchasing a separate, stand-alone interest rate floor to offset the loan floor.
Interest Rate Cap Hub: Pricing & Volatility Update for 9/8/2026
Current 1-Month SOFR = 3.74231% (Prior Day’s Reset: 3.76115%)
1-Month Term SOFR has been rising as we approach the FOMC meeting
Rate volatility settled down a touch last week due to the long weekend (See Chart 3, below)
Despite pockets of intraday volatility recently, interest rates are currently trading in a narrow range
Cap premiums remain in a tight range as the market seeks direction
Cap Pricing Matrix:1-Month Term SOFR Cap Premiums: Week-On-Week
Notional Amount | Tenor | Strike Rate | ~Premium 9/1/26 | ~Premium 9/8/26 Open* |
$25,000,000 | 1-Year | 3.50% | ~$171k | ~$170k |
$25,000,000 | 1-Year | 4.50% | ~$37k | ~$38k |
$25,000,000 | 2-Year | 3.50% | ~$394k | ~$404k |
$25,000,000 | 2-year | 4.50% | ~$122k | ~$131k |
$25,000,000 | 3-Year | 3.50% | ~$626k | ~$650k |
$25,000,000 | 3-Year | 4.50% | ~$236k | ~$254k |
*Indications as of Market Open. Premium levels provided are indications only and subject to frequent change.
CHART 3:Historical Volatility: MOVE Composite US Treasury Yield Volatility Index - Year-To-Date 2026
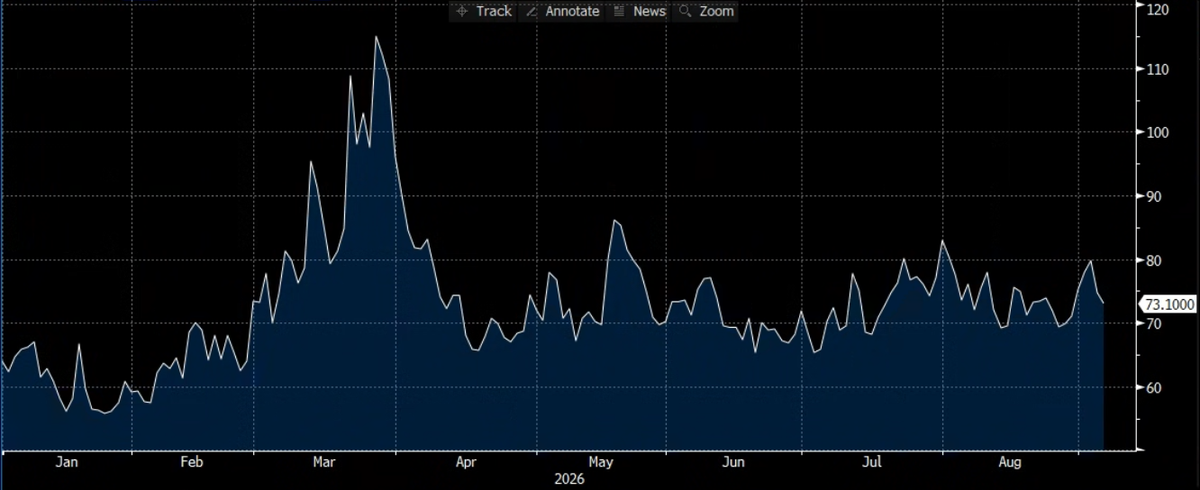
Source: Bloomberg, LLP | HISTORICAL US TREASURY YIELD VOLATILITY, “MOVE” INDEX – YTD 2026
^NOTE:RATE MARKETS CAN BE VOLATILE - MARKET DYNAMICS AND PRICING CAN CHANGE VERY QUICKLY IN THIS MARKET ENVIRONMENT.
**WE RECOMMEND YOU CALL US FOR ACCURATE, UP-TO-THE-MINUTE CAP INDICATIONS.**
Please contact us if you would like to discuss an upcoming rate cap or rate cap extension, explore ways to reduce or eliminate escrow deposits for replacement caps or learn more about interest rate Caps, Floors, Swaps or Swaptions. RCA can also assist you with the voluntary early termination of your cap or swap.
HedgeWithAnEdge-TheRCAEdge!

Disclaimer: The information provided in this communication is intended for discussion purposes only. Nothing presented in this communication should be taken as a recommendation or forecast. All market data shown is indicative only and subject to change depending on current market conditions. The information in this publication is confidential and is intended for the recipient only.